


Overview
What does the course cover?
Excel 2016 Charts provide a powerful way to summarise and report on vast amounts of Data graphically. You’ll learn in detail how Charts work, the different types of Charts and their uses as well as their editable features. This course is vital to gaining the most from this powerful feature of Excel.

Aims
Why take this course?
This course covers the use of Charts, one of the most visually powerful tools available in Excel, from their basic insertion right through to their customization – use of the secondary axis and trendlines. If you need to work with data in Excel and report on that data, chances are that Charts will provide the fastest way to visually report on that data.

Audience
Who would benefit?
Anyone using Excel unfamiliar with Charts who is working with lists of data, perhaps filtering or sorting that data. Charts provide a powerful way to show the data quickly and easily. The advanced editing options of Charts will enhance the reports of those already using basic Charts in their worksheets.
Course Preview
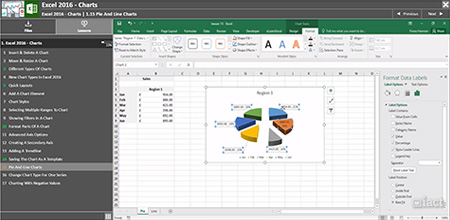
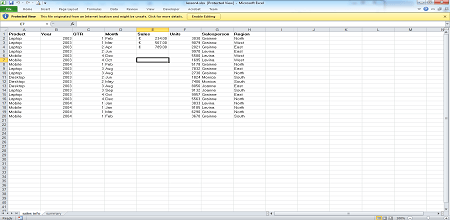
Each course contains high quality, professional video lessons, downloadable exercise files and real-world templates for you to use.
Course Details
Section 1: Charts
- Lesson 1: Insert & Delete a Chart
- Lesson 2: Move & Resize a Chart
- Lesson 3: Different Types of Charts
- Lesson 4: New Chart Types in Excel 2016
- Lesson 5: Quick Layouts
- Lesson 6: Add a Chart Element
- Lesson 7: Chart Styles
- Lesson 8: Selecting Multiple Ranges to Chart
- Lesson 9: Showing Filters in a Chart
- Lesson 10: Format parts of a Chart
- Lesson 11: Advanced Axis Options
- Lesson 12: Creating a secondary Axis
- Lesson 13: Adding a Trendline
- Lesson 14: Saving the Chart as a Template
- Lesson 15: Pie and Line Charts
- Lesson 16: Change Chart type for one series
- Lesson 17: Charting with Negative Values

Skills You’ll Learn
What you’ll be able to do after the course
- Insert and delete charts
- Move and resize charts
- Add chart elements
- Selecting multiple ranges to charts
- Use secondary axis and trendlines
- Saving the chart as template
- Chart with negative values

How You Can Apply These Skills
What you’ll be able to use these skills for
- Present data easily
- Filter and sort data quickly
- Enhance reports with advanced formatting
- Design easy to use Chart templates
- Track how large spreadsheets work and trace errors
- Use Excel Forms for data entry
- Work with multiple spreadsheets at the same time
Certification
When you pass you will receive an internationally recognized accreditation certificate like this:


What’s next?
If you would like to learn more about Excel 2016, Pivot Tables, Macros and Formulas and Functions courses might also be of interest.

Careers that require these skills at this level?
Excel is used in practically every business and in nearly all departments in those businesses – ranging from sales to accounting and administration. Any finance role will require you to be proficient to this level.

Want to start learning today?
Joining is simple, easy and risk free with our 7 day money back guarantee.


